


This article was published in partnership with Stateline.
Introduction
The Center for Public Integrity is a nonprofit newsroom that investigates betrayals of public trust. Sign up to receive our stories.
The first installment of a new national data release that will help journalists and researchers analyze polling place accessibility was released Tuesday as part of an investigative series, Barriers to the Ballot Box, from The Center for Public Integrity and Stateline. The data, posted to Github, includes polling place locations and addresses for 30 states for the 2012, 2014, 2016 and 2018 general elections, and is aimed at aiding reporting and research on the impact that polling place closures and changes could have on the 2020 election. Data for additional states will be added in the coming weeks.
Polling place reductions and changes can lower turnout by creating confusion and barriers for voters, potentially disenfranchising them. There is no national public dataset of polling place locations and addresses for past federal elections.
In 2013, the U.S. Supreme Court struck down key parts of the Voting Rights Act in Shelby County v. Holder, eliminating the requirement that jurisdictions with a history of racial discrimination in voting seek permission from the Department of Justice for proposed voting changes — including polling place reductions and changes. In recent years, civil rights organizations and voting rights experts have expressed concerns about the effects of these changes on voters of color, especially in the context of existing voter ID laws, purges of voter rolls and other actions that have threatened the ability to vote.
“When you have that kind of disparity in population, you’re going to have a disparity in wait times, a disparity in access,” said Carol Anderson, a professor of African American studies at Emory University and author of the book One Person, No Vote. “And long lines then lead to their own form of voter suppression. People have to leave. People get discouraged.”
This year, a primary season marred by unprecedented polling place consolidations forced by the coronavirus pandemic, featuring indelible images of voters standing in hours long lines to cast ballots, added new urgency.
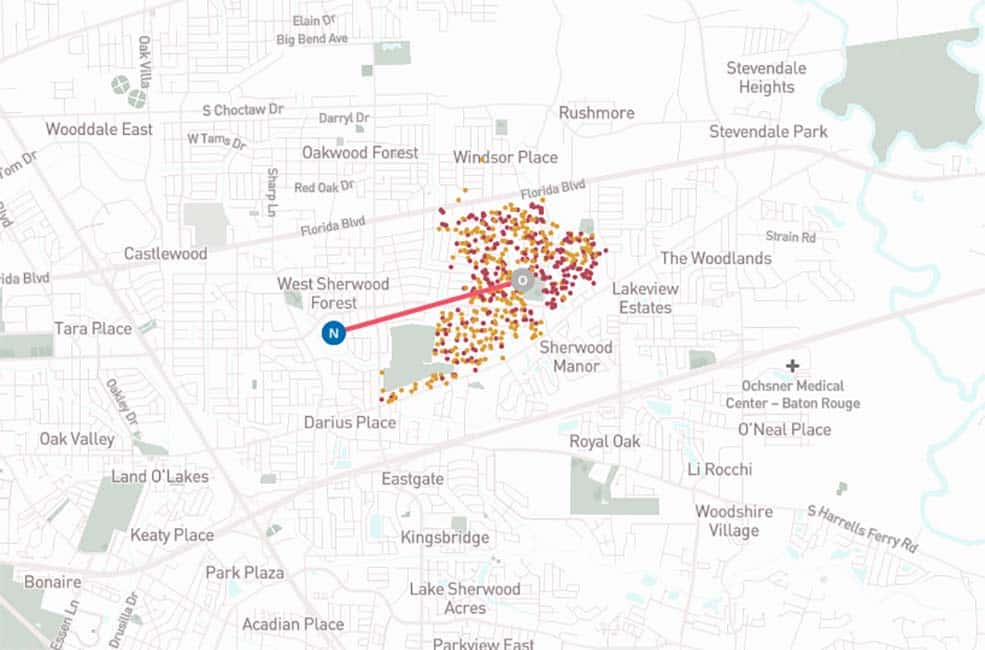
The polling place location information, now in a usable data format, standardized and available to the public, can be used to track the movement and consolidation of polling places. Combined with other data, such as voter file data, it can shed new light on which voters were affected by the changes.
“Knowing where these polling places are will actually be really valuable,” Charles Stewart III, a professor of political science at the Massachusetts Institute of Technology, said of the data release. “When we study the effects of polling place closures, especially during COVID, the most powerful things you can say are those that leverage change over time. This allows us to do that.”
Policy makers, election analysts and researchers will be able to “examine, in much more detail, how polling place location closures affects participation, how changes in the distance of polling places from voters affects participation,” said Richard Pildes, a New York University School of Law constitutional law professor who works on issues of election law, and the location data makes it “much richer information.”
Vital reporting to ensure a free and fair election. You can help.
U.S. elections are administered by thousands of separate jurisdictions. Every state has different laws and deadlines governing voting, which can include unique requirements for polling places. Local authorities typically choose them based on a variety of factors.
Public Integrity and Stateline filed and tracked roughly 1,200 records requests to assemble the polling place location data.
In 12 states — Alabama, California, Georgia, Idaho, Kansas, Minnesota, Missouri, New Mexico, New York, Tennessee, Texas and Wyoming — data had to be obtained county by county for at least one of those elections.
The records came in a variety of formats — Excel spreadsheets, PDFs, XML files, handwritten pages, lists contained in resolutions passed by county boards, GIS data. The vast majority of states and counties provided the data without charge, but not all: Fees ranged from a modest 50 cents (Barton County, Kansas) to a high of $372.25 (the state of Louisiana).
Public Integrity and Stateline eventually were able to assemble polling place data for the four general elections for every state except those that now vote primarily by mail: Colorado, Hawaii, Oregon, Washington and Utah.
Politicians from both major parties have called on local election officials to open as many in-person polling places as possible for the general election. The Centers for Disease Control and Prevention said election administrators should “maintain or increase the total number of polling places available to the public on Election Day to improve the ability to social distance” and avoid increasing the number of voters assigned to any one location.
Sign up for The Moment newsletter
Our CEO Susan Smith Richardson guides you through conversations and context on race and inequality.
But local election officials, struggling with spiraling costs, staffing shortages and social distancing requirements, have warned they may have to offer fewer locations. Public Integrity and Stateline are releasing the data now to help illuminate how the changes affect voters.
Many polling place changes and cuts happen for logistical or financial reasons. A school may be under construction and unavailable. A church or a senior center may decide against serving as a polling place (especially this year). Growth in use of mail ballots in some jurisdictions means fewer voters at the polls on Election Day. And in the climate crisis, polling places may burn down in wildfires or be inundated with floodwaters.
Local officials, strapped for resources, might also be trying to save money by consolidating two or more locations that each serve small numbers of voters, said Stewart. This issue, he said, has been prevalent in urban areas.
“Is this suppression,” he asked, “or is this the reality of providing voting as a government service, given the challenges of providing government services in underserved, minority communities?”
Another factor: Many states, including Arizona and Texas, two states subject to preclearance restrictions before Shelby, have allowed counties to adopt regional vote centers, a change that means voters in the jurisdiction can vote at any location, not just at a single assigned polling place. Proponents say that even though jurisdictions using vote centers offer fewer locations for voting, vote centers actually give voters more options. Seventeen states allow the use of vote centers, according to the National Conference of State Legislatures, though not every county in each of those states uses them (and Iowa does not use them for federal elections).
This year, more states and counties are turning to vote centers as a way to combat the strains of the pandemic and use larger spaces with room for social distancing, such as fairgrounds or arenas. Maryland, for example, is consolidating its usual 1,600 polling places into a few hundred vote centers after local election officials told the governor they could not find enough poll workers to staff the usual number of locations.
Join the conversation
Show Comments